by ptrikha21 » 16 Apr 2022, 18:09
- 1635143955944 (1).jpg (228.86 KiB) Viewed 101 times
Since last year Sept/Oct, I had started working on an idea.
I had started capturing my Crypto Trading and Investments Total on an App that I use: Zebpay.
I had a plan of a time based Research on the portfolio to validate certain hypothesis as well as thinkings I had in this field.
Yet as with any new beginnings, there can be challenges plus deviations.
As I am also into a full time job plus family responsibilities, I was able to track but somehow got deviated a bit and in fact, lost a sense of some of my initial thoughts.
Anyways here are the key observations together with images (if I miss some images), I would try to add on later:
Observations started in Sep 2021:
(All figures rounded off and in Indian Rupees)
Sep 2021 : Total of 9524
BTC : 22%, BCH : 18%, ETH : 16%
Then some sellings.
So
15th Oct 2021 holdings : 8895 Rs.
BTC increases to 28%, ETH to 17%, BCH down to 16%
Around Oct end : 9095; BTC rises to 29%
13 Nov : 13691 : BTC down in % share to 25% as I bought Decentreland (MANA) at this time.
Some buyings and sellings and then down to : 13675: but overal MANA share increases to more than that of BTC.
This went down for MANA later on as I sold some.
The current holdings are close to 9k since I had to sell some to meet exigencies.
Overall obseravtions and lessons:
1)Time based tracking lets us know which Crypto currency has risen and which has falen in our portfolio and we can go for a rebalancing if we feel like.
and a lots of Need to : (action points)
2)Capture % of each holdings in a text file or a sheet of paper.
3)A fixed frequency of recording. With my schedule, a once in 2 months can be good.
Yet Monthly recording can also be a good enough time frame.
4)% change of each currency: whether a rise, fall or stagnant.
Now this would be the real tester and time taker but it would make the analysis stronger and a more validating one.
Overall, a good beginning though I now realize that a long term "Real" research is like what people do for phD degree, although an informal research can give us more liberty unlike a formal phD program.
What do you say?
Did you like my "Empirical" study?
For more such thought provoking Articles, insights and discussions, do come and join the wonderful world of Forumcoin. An English language forum, where you can discuss and share idqeas and opinions on a variety of topics.
For sign up, click here :
index.php?r=5080-- 16 Apr 2022, 23:44 --
ptrikha21 wrote:
- 1635143955944 (1).jpg (228.86 KiB) Viewed 101 times
- 1635143955944 (1).jpg (228.86 KiB) Viewed 101 times
- 1635143955944 (1).jpg (228.86 KiB) Viewed 101 times
- 1635143955944 (1).jpg (228.86 KiB) Viewed 101 times
Since last year Sept/Oct, I had started working on an idea.
I had started capturing my Crypto Trading and Investments Total on an App that I use: Zebpay.
I had a plan of a time based Research on the portfolio to validate certain hypothesis as well as thinkings I had in this field.
Yet as with any new beginnings, there can be challenges plus deviations.
As I am also into a full time job plus family responsibilities, I was able to track but somehow got deviated a bit and in fact, lost a sense of some of my initial thoughts.
Anyways here are the key observations together with images (if I miss some images), I would try to add on later:
Observations started in Sep 2021:
(All figures rounded off and in Indian Rupees)
Sep 2021 : Total of 9524
BTC : 22%, BCH : 18%, ETH : 16%
Then some sellings.
So
15th Oct 2021 holdings : 8895 Rs.
BTC increases to 28%, ETH to 17%, BCH down to 16%
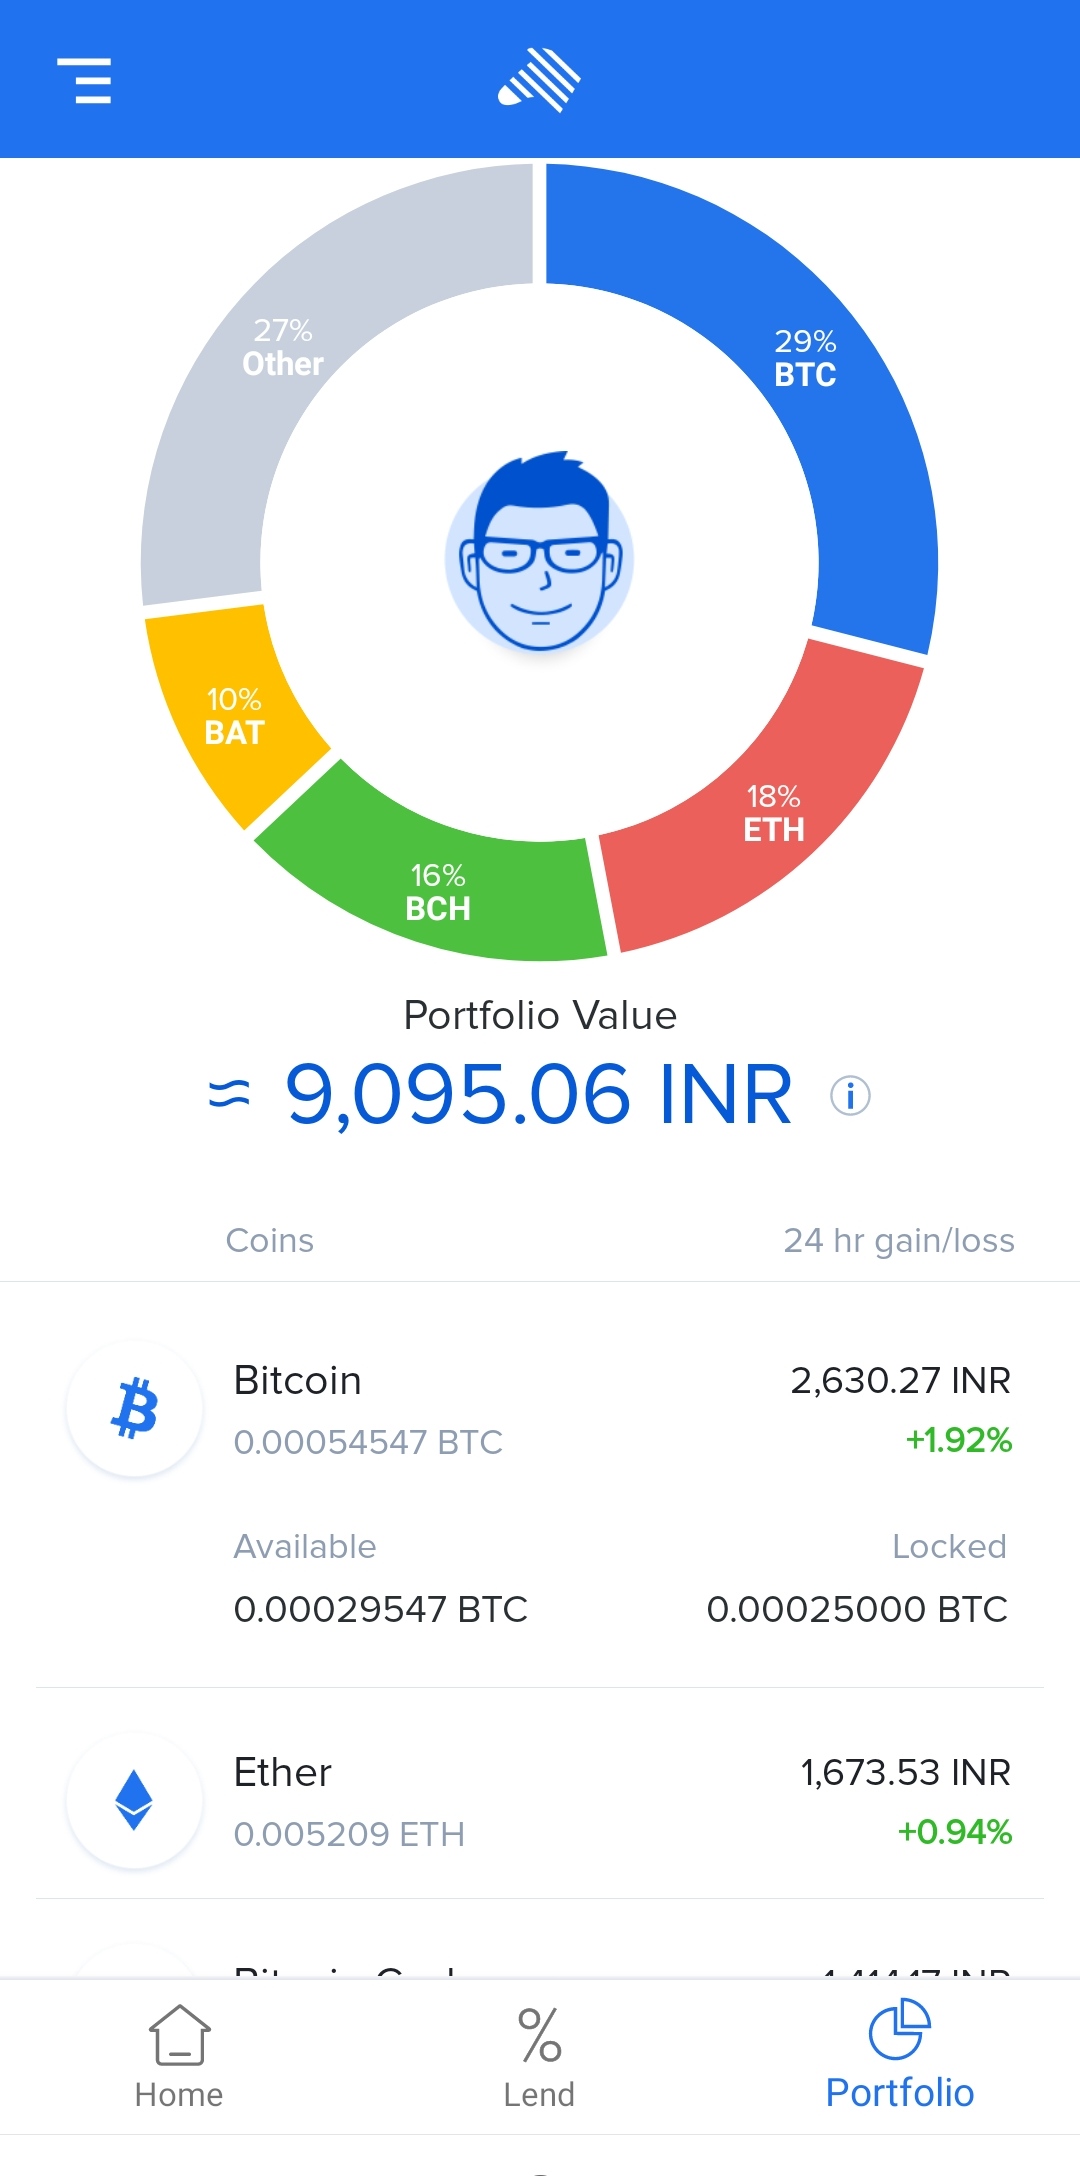
Around Oct end : 9095; BTC rises to 29%
13 Nov : 13691 : BTC down in % share to 25% as I bought Decentreland (MANA) at this time.
Some buyings and sellings and then down to : 13675: but overal MANA share increases to more than that of BTC.
This went down for MANA later on as I sold some.
The current holdings are close to 9k since I had to sell some to meet exigencies.
Overall obseravtions and lessons:
1)Time based tracking lets us know which Crypto currency has risen and which has falen in our portfolio and we can go for a rebalancing if we feel like.
and a lots of Need to : (action points)
2)Capture % of each holdings in a text file or a sheet of paper.
3)A fixed frequency of recording. With my schedule, a once in 2 months can be good.
Yet Monthly recording can also be a good enough time frame.
4)% change of each currency: whether a rise, fall or stagnant.
Now this would be the real tester and time taker but it would make the analysis stronger and a more validating one.
Overall, a good beginning though I now realize that a long term "Real" research is like what people do for phD degree, although an informal research can give us more liberty unlike a formal phD program.
What do you say?
Did you like my "Empirical" study?
For more such thought provoking Articles, insights and discussions, do come and join the wonderful world of Forumcoin. An English language forum, where you can discuss and share idqeas and opinions on a variety of topics.
For sign up, click here :
index.php?r=5080
[attachment=0]1635143955944 (1).jpg[/attachment]Since last year Sept/Oct, I had started working on an idea.
I had started capturing my Crypto Trading and Investments Total on an App that I use: Zebpay.
I had a plan of a time based Research on the portfolio to validate certain hypothesis as well as thinkings I had in this field.
Yet as with any new beginnings, there can be challenges plus deviations.
As I am also into a full time job plus family responsibilities, I was able to track but somehow got deviated a bit and in fact, lost a sense of some of my initial thoughts.
Anyways here are the key observations together with images (if I miss some images), I would try to add on later:
Observations started in Sep 2021:
(All figures rounded off and in Indian Rupees)
Sep 2021 : Total of 9524
BTC : 22%, BCH : 18%, ETH : 16%
Then some sellings.
So
15th Oct 2021 holdings : 8895 Rs.
BTC increases to 28%, ETH to 17%, BCH down to 16%
Around Oct end : 9095; BTC rises to 29%
13 Nov : 13691 : BTC down in % share to 25% as I bought Decentreland (MANA) at this time.
Some buyings and sellings and then down to : 13675: but overal MANA share increases to more than that of BTC.
This went down for MANA later on as I sold some.
The current holdings are close to 9k since I had to sell some to meet exigencies.
Overall obseravtions and lessons:
1)Time based tracking lets us know which Crypto currency has risen and which has falen in our portfolio and we can go for a rebalancing if we feel like.
and a lots of Need to : (action points)
2)Capture % of each holdings in a text file or a sheet of paper.
3)A fixed frequency of recording. With my schedule, a once in 2 months can be good.
Yet Monthly recording can also be a good enough time frame.
4)% change of each currency: whether a rise, fall or stagnant.
Now this would be the real tester and time taker but it would make the analysis stronger and a more validating one.
Overall, a good beginning though I now realize that a long term "Real" research is like what people do for phD degree, although an informal research can give us more liberty unlike a formal phD program.
What do you say?
Did you like my "Empirical" study?
For more such thought provoking Articles, insights and discussions, do come and join the wonderful world of Forumcoin. An English language forum, where you can discuss and share idqeas and opinions on a variety of topics.
For sign up, click here :
https://forumcoin.com/index.php?r=5080
-- 16 Apr 2022, 23:44 --
[quote="ptrikha21"]
[attachment=0]1635143955944 (1).jpg[/attachment]
[attachment=0]1637836224942.jpg[/attachment]
[attachment=0]2021-10-15.jpg[/attachment]
[attachment=0]13Nov_Zpay.jpg[/attachment]
Since last year Sept/Oct, I had started working on an idea.
I had started capturing my Crypto Trading and Investments Total on an App that I use: Zebpay.
I had a plan of a time based Research on the portfolio to validate certain hypothesis as well as thinkings I had in this field.
Yet as with any new beginnings, there can be challenges plus deviations.
As I am also into a full time job plus family responsibilities, I was able to track but somehow got deviated a bit and in fact, lost a sense of some of my initial thoughts.
Anyways here are the key observations together with images (if I miss some images), I would try to add on later:
Observations started in Sep 2021:
(All figures rounded off and in Indian Rupees)
Sep 2021 : Total of 9524
BTC : 22%, BCH : 18%, ETH : 16%
Then some sellings.
So
15th Oct 2021 holdings : 8895 Rs.
BTC increases to 28%, ETH to 17%, BCH down to 16%
Around Oct end : 9095; BTC rises to 29%
13 Nov : 13691 : BTC down in % share to 25% as I bought Decentreland (MANA) at this time.
Some buyings and sellings and then down to : 13675: but overal MANA share increases to more than that of BTC.
This went down for MANA later on as I sold some.
The current holdings are close to 9k since I had to sell some to meet exigencies.
Overall obseravtions and lessons:
1)Time based tracking lets us know which Crypto currency has risen and which has falen in our portfolio and we can go for a rebalancing if we feel like.
and a lots of Need to : (action points)
2)Capture % of each holdings in a text file or a sheet of paper.
3)A fixed frequency of recording. With my schedule, a once in 2 months can be good.
Yet Monthly recording can also be a good enough time frame.
4)% change of each currency: whether a rise, fall or stagnant.
Now this would be the real tester and time taker but it would make the analysis stronger and a more validating one.
Overall, a good beginning though I now realize that a long term "Real" research is like what people do for phD degree, although an informal research can give us more liberty unlike a formal phD program.
What do you say?
Did you like my "Empirical" study?
For more such thought provoking Articles, insights and discussions, do come and join the wonderful world of Forumcoin. An English language forum, where you can discuss and share idqeas and opinions on a variety of topics.
For sign up, click here :
https://forumcoin.com/index.php?r=5080[/quote]